159
Explore
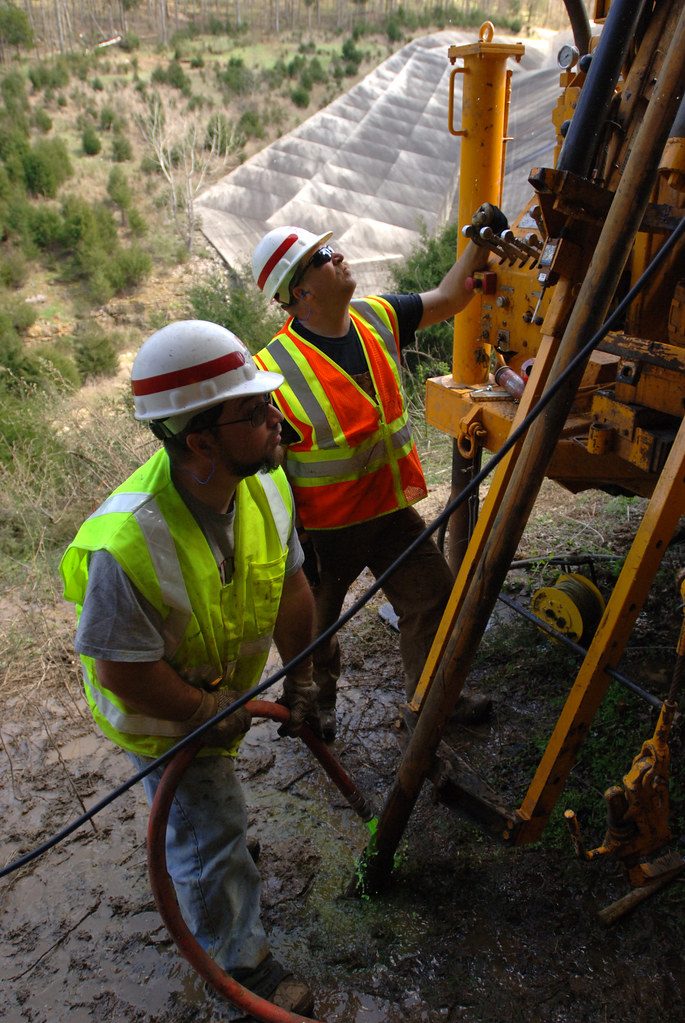
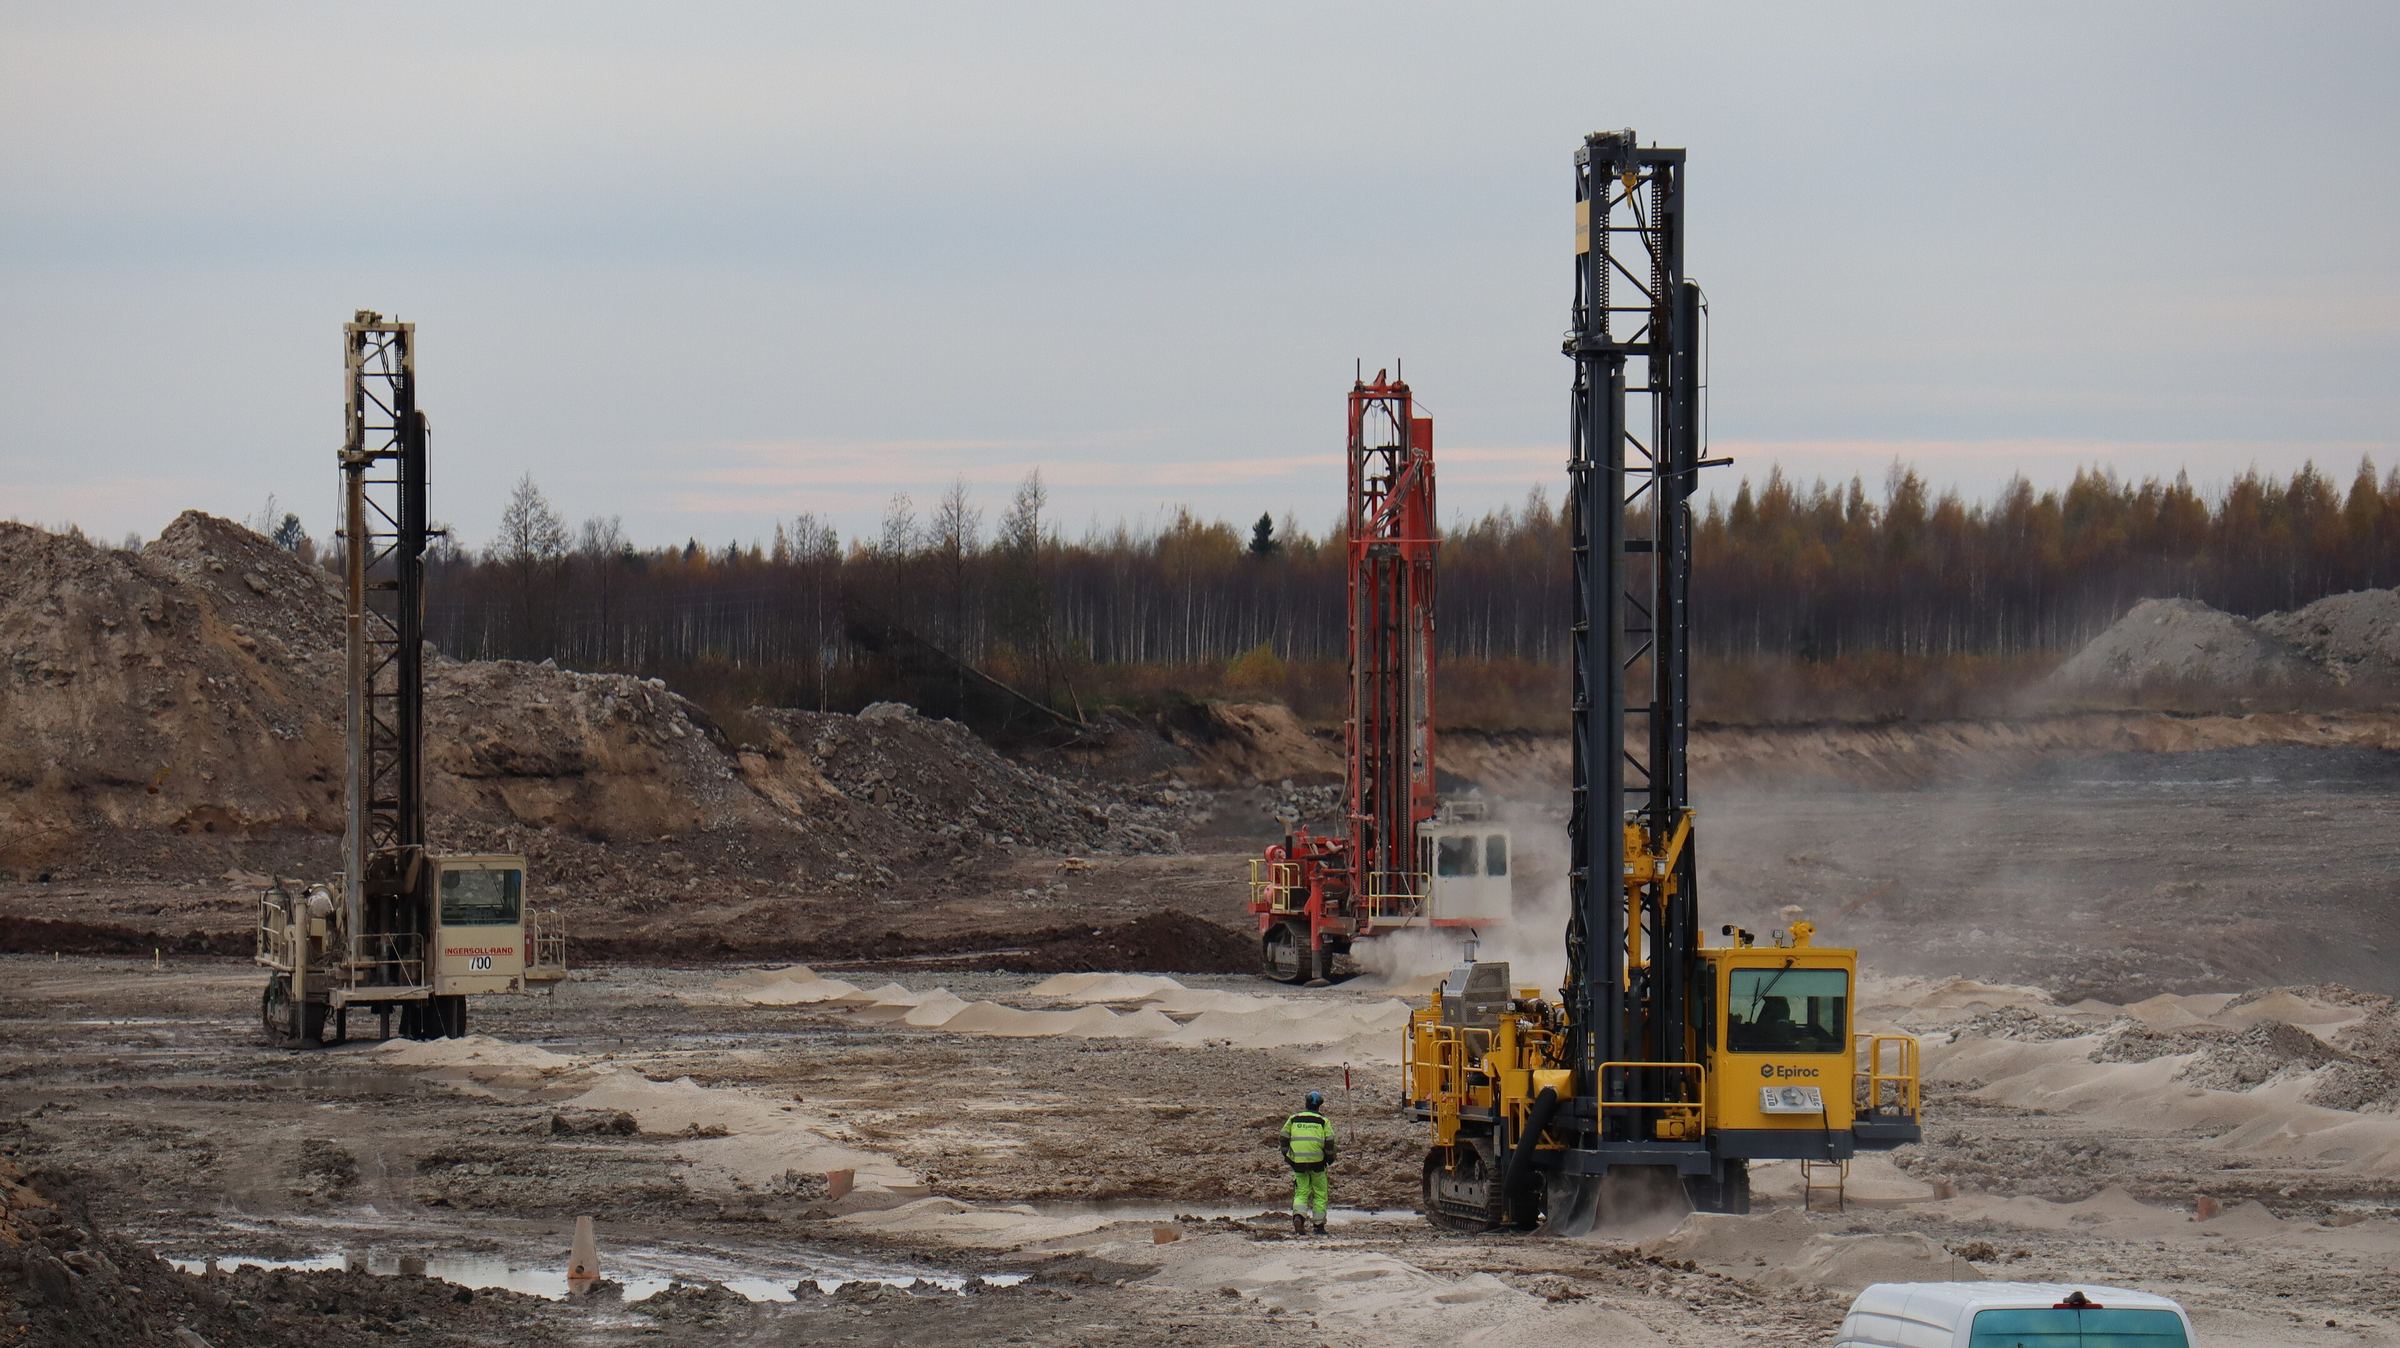
Drill results, grade and resource definition at the earliest and highest-risk stage.

Mining & natural resources intelligence
Garvner Capital Intelligence is an independent research firm covering the mining companies listed in London. We analyse company filings, trace each figure to its source document and verify it before publication.
Our perspective
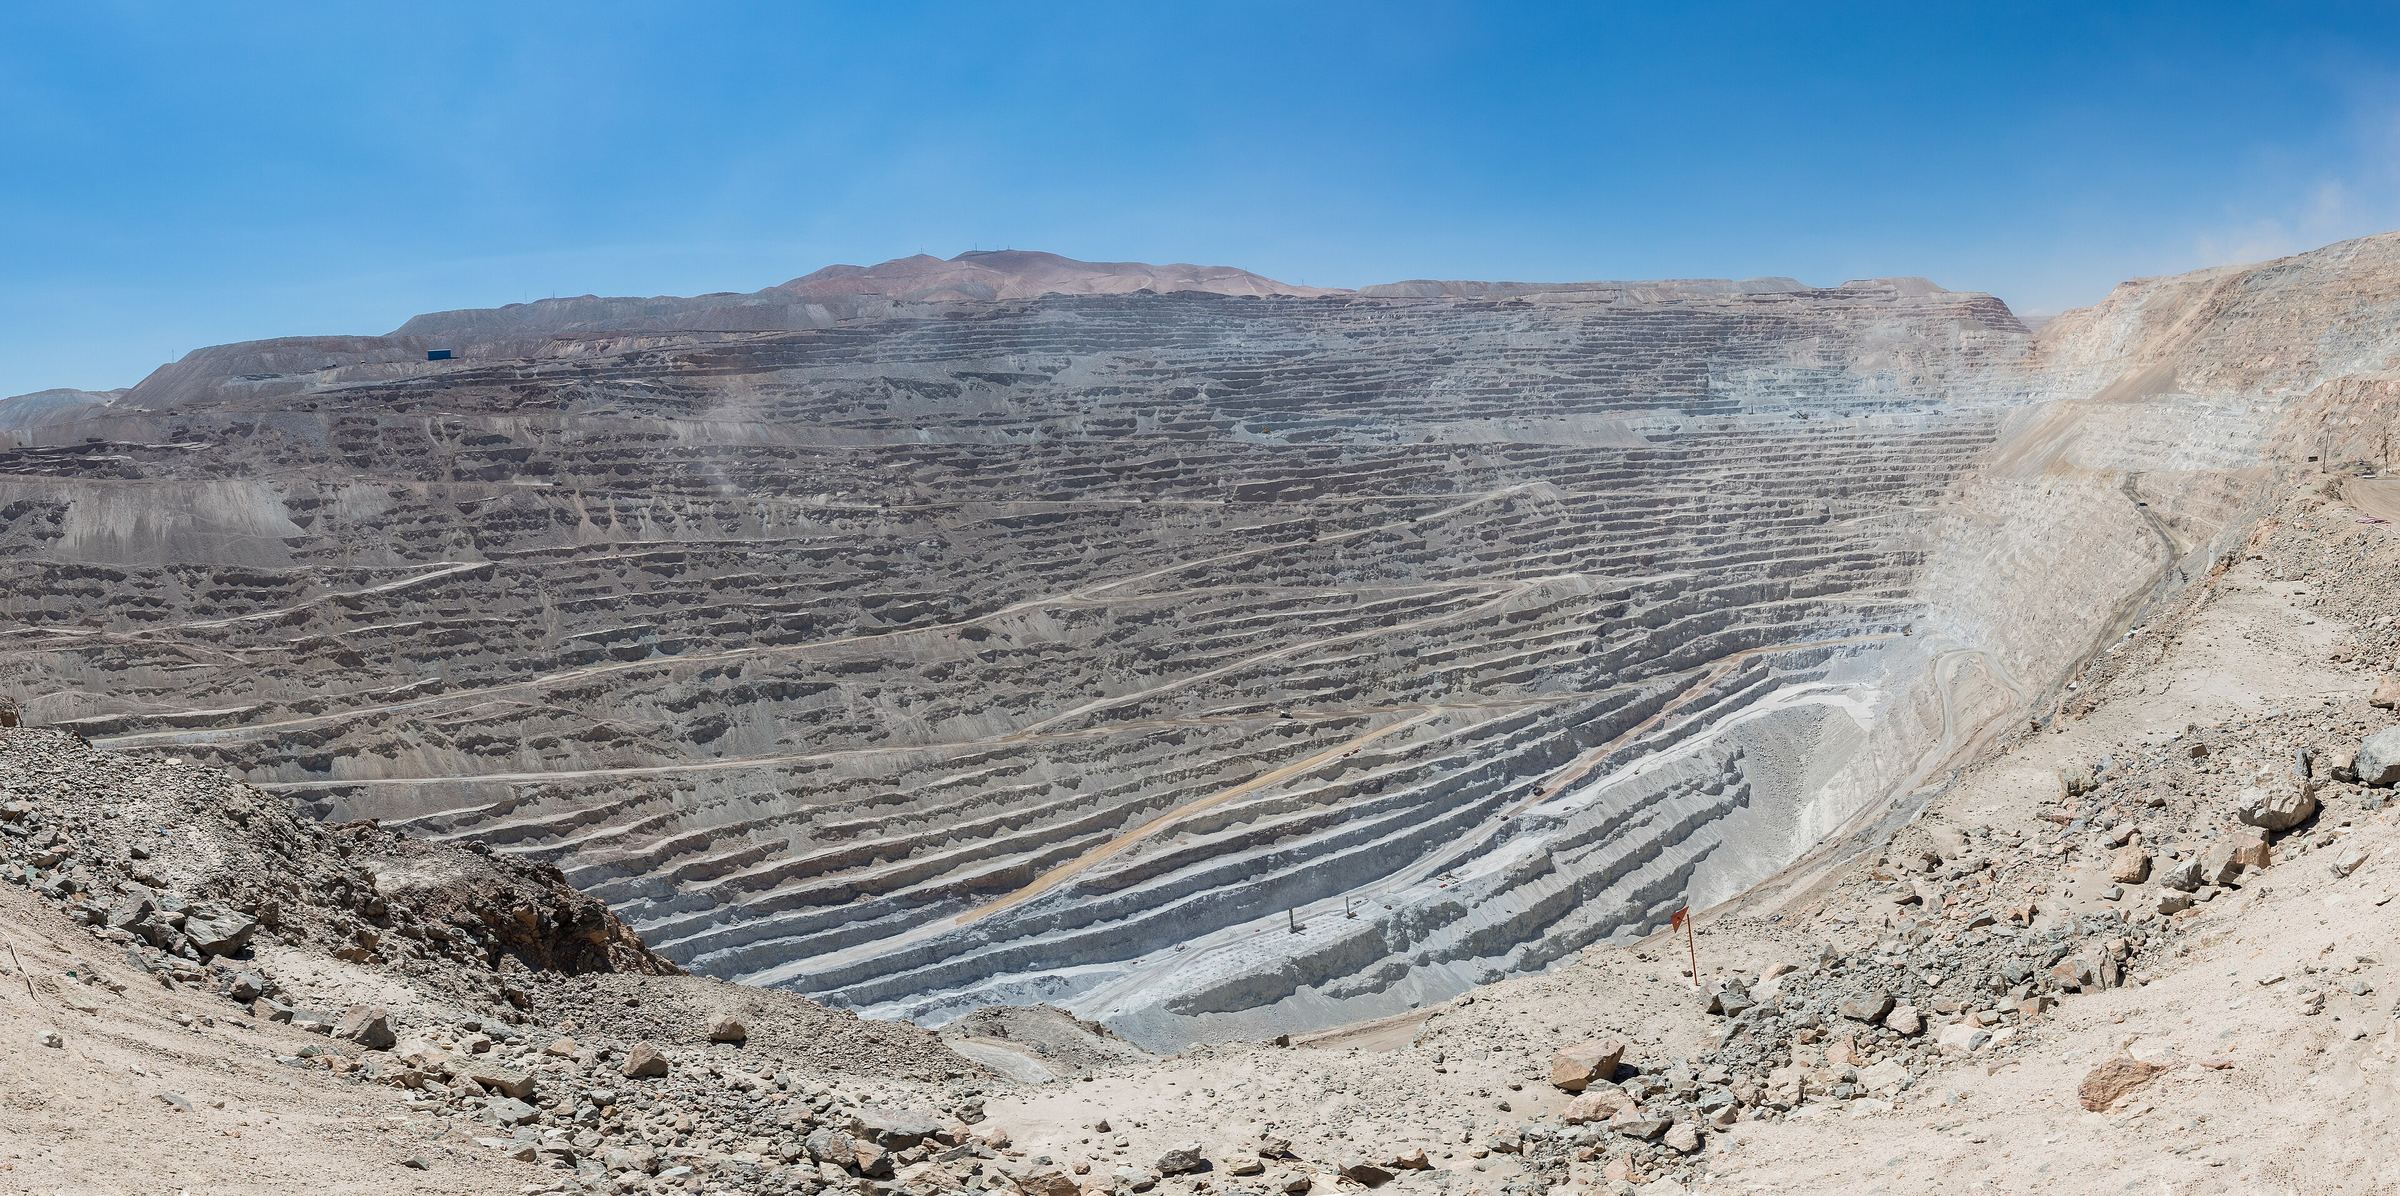
Almost 180 mining and resource companies are listed on AIM and the LSE Main Market, with operations in 68 countries. Their disclosures are spread across thousands of documents, prepared to different standards and timetables. Garvner consolidates this information into a single, consistent framework, enabling direct comparison across companies, commodities and jurisdictions.
More than a third of the mines and projects in our coverage are in Africa, from South Africa to Mali. Rigorous, source-based analysis is essential for investors assessing these assets from overseas.
Exploration projects carry the widest range of outcomes and the most limited disclosure. Verified data is most valuable where information is scarcest.
More than half of the assets in our coverage are gold or copper, two commodities of central importance to investors in the current cycle.
Source: Garvner database. 388 mines and projects owned by 179 companies on AIM and the LSE Main Market, as of 6 November 2026.
Case study
The following figures are drawn from our research file on Hochschild Mining plc (LSE: HOC), a precious metals producer with operations in Latin America. Each is presented with its source document, page reference and supporting text.
Each has been matched, through automated source checks, to the page of the filing from which it was taken. Five are shown below.
“Full-year attributable production of 311,509 gold equivalent ounces (2024: 347,374 ounces).”
“Revenue 5 1,208,575 (26,427) 1,182,148”
Consolidated income statement, US$ thousands. Total column shown.
“Adjusted EBITDA 583,729 421,354 39”
US$ thousands: 2025, 2024 and percentage change.
Per gold-equivalent ounce, all operations including corporate costs.
Reported as 3,111 thousand ounces.
Figures as at 6 November 2026, drawn from the public filings of Hochschild Mining plc. Hochschild Mining plc has not reviewed or endorsed this material. This information does not constitute investment advice, a valuation or a recommendation.
Coverage by stage
Drill results, grade and resource definition at the earliest and highest-risk stage.
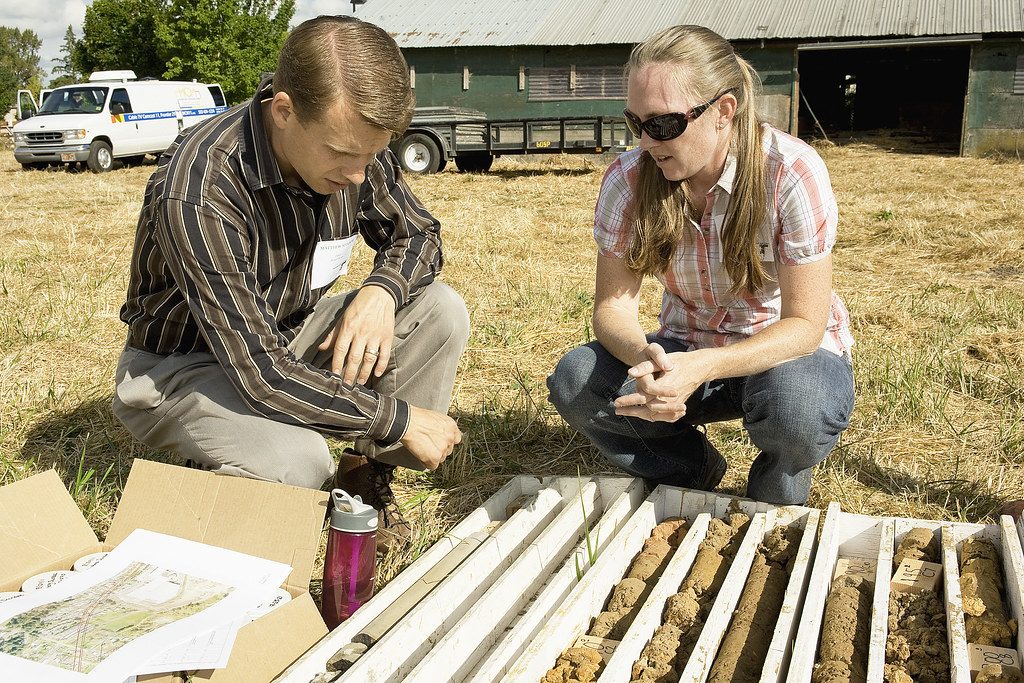
Feasibility studies, permitting, financing and construction, where capital and timelines are tested.
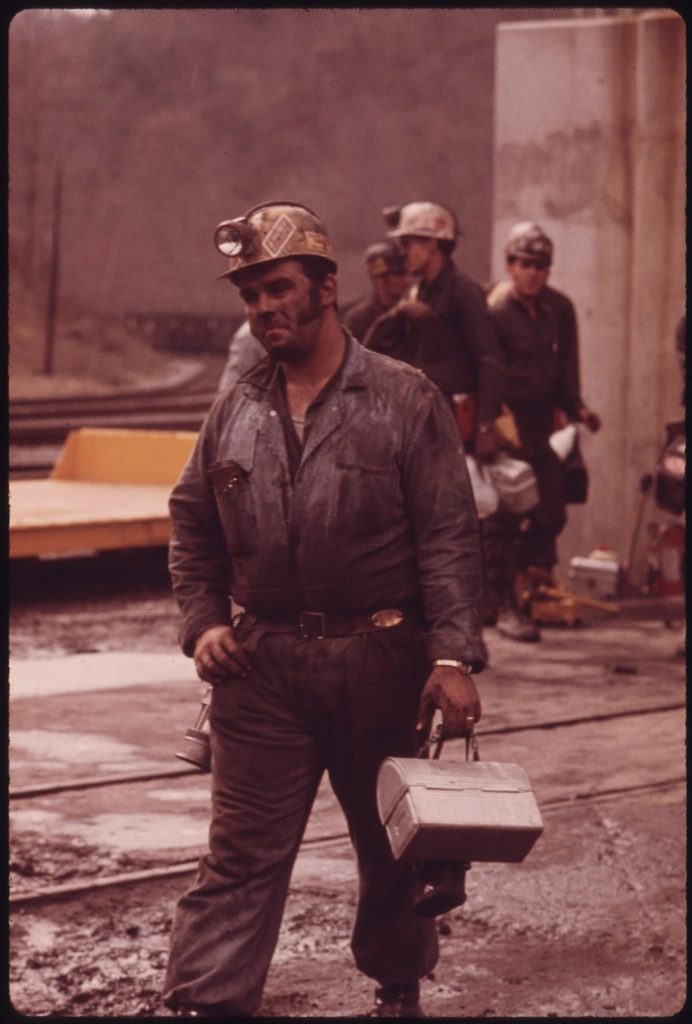
Output, unit costs, reserves and cash generation across producing operations.
Mines and projects by stage, from the Garvner database. A further six are on care and maintenance and two are pending classification, for a total of 388.
Coverage
Each mine and project is linked to its owner and listing venue. South Africa, Australia, the United States, Zambia and Zimbabwe account for the largest concentrations.
Source: Garvner database · AIM and LSE Main Market · As of 6 November 2026
Our framework
What does the company own, and where?
What is it worth?
How do its operations generate cash?
Who leads it, and what is their record?
What are the next catalysts, and when?
What are the principal risks?
Does the investment case hold?
Methodology
Our four-stage process ensures that every figure can be traced from the original filing to the final report.
Annual reports, results, technical reports and regulatory announcements for every company in our coverage.
2,150+ filings · 8,900 announcementsEach data point is captured with its page reference and supporting text.
15,400+ evidence itemsEvery figure is checked against its source before publication.
19,200+ automated source checksConsistent, comparable data across companies, assets and reporting periods.
13,400+ data pointsA source check is an automated test that finds a recorded figure or quotation on the page of the original document it was taken from.
Sixty years in mining have taught our team that figures alone never tell the full story. Garvner exists to provide the context and the evidence that lead to sound decisions.
What we do
Our team brings sixty years of combined experience across exploration, operations and corporate leadership in mining, applied with a rigorous, evidence-based methodology.
Comprehensive research files, built on our seven-question framework and every relevant filing.
Request a demo
Fourteen commodities, 68 countries and all twelve stages of the mining lifecycle, in a single comparable view.
Explore coverage
Close to 1,000 defined metrics across 26 specialist mining modules, structured for direct use in financial models.
How it worksGlobal presence
Garvner’s team and representatives are based in New York, London, Berlin, Hong Kong and Sydney, close to the investors who follow these companies.
Engage with Garvner
A focused presentation of Garvner’s research, built around a company of your choosing.
Request a demo Pilot program · Now open Request early accessEarly access to Garvner, with direct engagement with our research team and input into the platform’s development.
Request early accessOr write to us directly at sales@garvner.co.